
Are charities beyond the crisis?
Financially, charities fared better than feared during the pandemic thanks to prudent management and much needed financial support from governments and philanthropists.
- Charities and social sector
 13 min read

Summary
- Prepared by Social Ventures Australia and the Centre for Social Impact, the fifth instalment of our Partners in Recovery series incorporates updated data on how charities fared during the first two and half years since the onset of Covid-19.
- Overall, the financial viability of the charity sector appears to have improved during the pandemic. The data shows that a smaller proportion of charities were loss-making in 2021 compared to 2019. Yet while the overall picture is positive, some parts of the sector fared better than others.
- Looking ahead, charities face renewed financial pressures from the current economic context – in particular rising inflation, increasing wage costs and staff shortages. These come on top of the structural constraints for the sector highlighted in our previous Partners in Recovery reports, that remain unchanged and contribute to underlying vulnerability.
- The analysis highlights the importance of government and philanthropy funding the full costs of charity service delivery to meet demand and support a healthy sector. Adequate funding to invest in core capabilities is crucial for thriving charities.
Prepared by Social Ventures Australia and the Centre for Social Impact, the fifth instalment of our Partners in Recovery series highlights the importance of government and philanthropy funding the full costs of charity service delivery to meet demand and support a healthy sector.
The Centre for Social Impact (CSI) and Social Ventures Australia (SVA) began the Partners in Recovery project in 2020. The project aims to help fill a gap in knowledge about the financial state of charities during the Covid-19 crisis, and prompt debate amongst decision makers and within the sector about the policy settings needed to sustain it.
The fifth Partners in Recovery report: Moving beyond the crisis, incorporates updated data on how charities fared during the first two and half years since the onset of Covid-19. It also reflects that the operating context has shifted significantly in what continues to be a challenging, complex and often unpredictable environment.
The analysis uses the most recent comprehensive data available – from the 2018, 2019, 2020 and 2021 Annual Information Statements submitted by charities to the Australian Charities and Not-for-profits Commission (ACNC). The analysis excludes very small charities (those with income and/or expenses less than $50,000) and charities with fewer than 0.8 full-time equivalent staff. It also excludes charities that did not provide the data required for analysis to the ACNC, and for which we were not able to reasonably extrapolate from the data provided. Approximately 25% fewer charities were included in the analysis for 2021 compared to the previous years. This was primarily due to a decrease in the number of charities who had submitted their data to the ACNC by 30 June 2022.
Charities fared better financially than feared over the last two years
Overall, the financial viability of the charity sector appears to have improved during the pandemic. The data shows that a smaller proportion of charities were loss-making in 2021 compared to 2019. In 2018 before the Covid-19 crisis, 65% of charities had an operating surplus (that is, revenue higher than expenses) (see Figure 1).
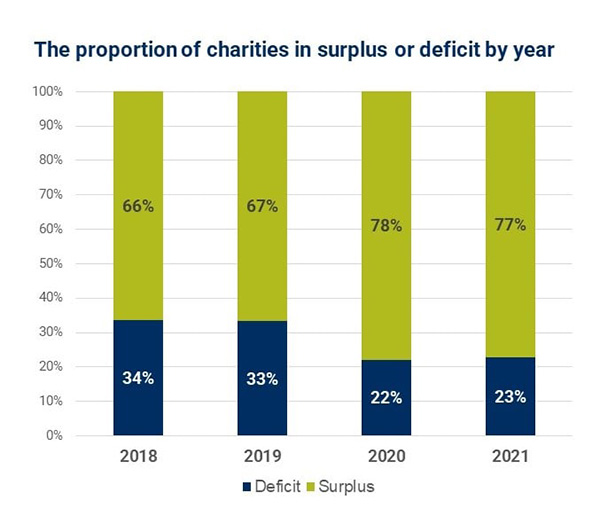
This increased to 78% in 2020. Approximately one-third of charities were operating in deficit in 2018 and 2019, reducing to one in five charities in 2020 and 2021.
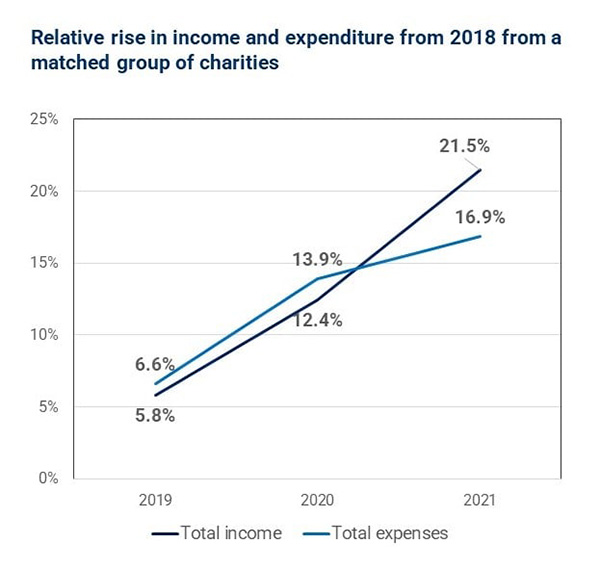
Growth was seen in both income and expenditure over time – based on a longitudinal analysis of a sub-group of charities from 2018 to 2021. However, while expenses rose at a slightly higher rate than revenue in 2020, income rose substantially faster than expenses in 2021 (see Figure 2). Over the period, total income increased by 21.5%, while total expenses only increased by 16.9%.1
One driver of the increase in expenses, was an increase in the number of staff employed by charities over this period. Using this same longitudinal dataset, we found that the total FTE (full time equivalents) employed by charities rose year on year from 2018 to 2021. The average number of FTE in this group of charities increased by 21%, from 44 FTE in 2018 to 53 FTE in 2021. The impacts were uneven with some charities taking on more staff and others decreasing their FTE during this period. However, the proportion of charities that decreased their FTE from 2020 to 2021 actually dropped, from 32% to 26%. This is likely due to a combination of increased demand and JobKeeper allowing charities to retain staff. However, while charities may have retained staff, they did not increase staffing at the same rate, with the growth of FTE notably slower from 2020 to 2021. It rose only 3% in this period, compared to a 14% increase from 2018 to 2019.
JobKeeper was significant for financial viability and charities were prudent
Much of the funding increase in 2021 is likely temporary government intervention via JobKeeper, which provided the charity sector with substantial and critical support as the crisis unfolded.
One hypothesis for the divergence between income and expenses is that the sector reacted to the temporary nature of that funding increase and did not take on long-term expenses or spend it all immediately. Instead, charities demonstrated prudent financial management and the temporary payments were used to provide higher service levels than pre-pandemic over a longer period.
Suzie Riddell, SVA’s CEO said at the report launch she was surprised but pleased to see the financial health of the sector. “The good thing about charity leaders responding quickly with that prudent decision-making and finding innovative ways to deliver services, to adapt to their staff needing to be online, or meeting new needs as they were arising inside communities, talks to the heart of people who work in the charity sector and the ability to be responsive, and innovative, and creative when needed.
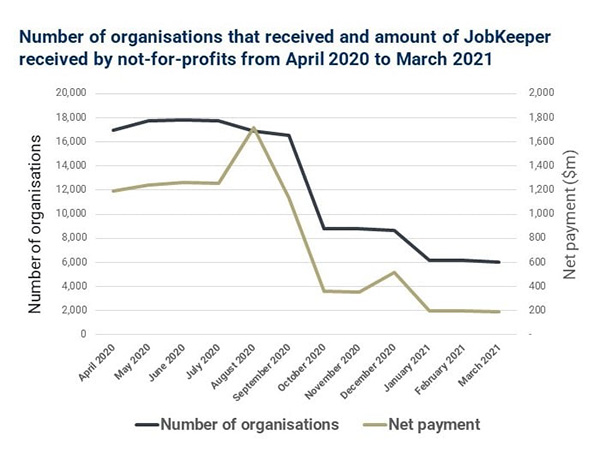
The majority of JobKeeper support for not-for-profits was provided during the first phase of payments, from April to September 2020 (Figure 3). According to ATO data, 19,031 not-for-profits (note this is a different but overlapping group to charities) received a total of $9.6 billion in JobKeeper support over JobKeeper Phases 1 and 2 (April 2020–March 2021).2 Eligibility requirements varied for many charities, with some being able to access the subsidy if their income dropped by 15%, while others were required to prove an income drop of 30% or more. Some very large charities – including universities – were excluded altogether.
Financial viability has improved, but a proportion of charities remain high risk
The number of charities in a precarious financial position decreased between 2019 and 2020. An analysis of charity vulnerability categorised charities into three groups based on their financial viability:
- High risk: Charities with an operating deficit, but not enough assets to cover six months of deficits.
- Vulnerable: Charities who are vulnerable as they have an operating deficit, but enough assets to cover six months of deficits
- Surviving: Charities with an operating surplus and likely to survive
The proportion of ‘vulnerable’ charities decreased from 31% in 2019 to 18% in 2021; the proportion of ‘surviving’ charities (those with an operating surplus) increased from 65% in 2018 to 76% in 2021 (see Figure 4).
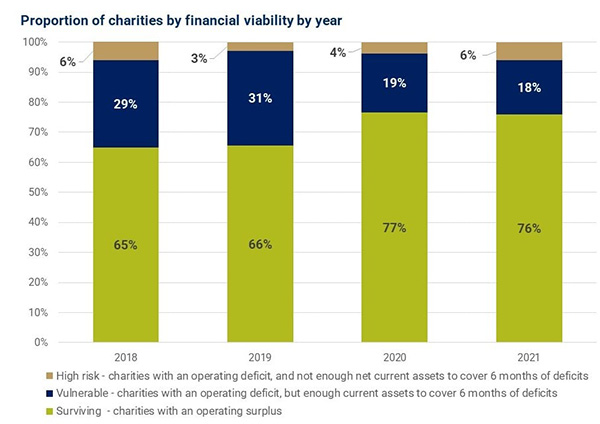
While the overall picture is positive, the proportion of high-risk charities remained relatively stable from 2018 to 2021 at between 3–6%. This could suggest that for some charities, the increase in funding has not necessarily led to an increase in long-term stability. Alternatively, it may reflect that some parts of the sector did not benefit equally from stimulus measures during the crises.
Furthermore, gaps in the data may be masking the full picture of what happened to charities. As noted above, fewer charities submitted data to the ACNC in 2021 at the time of our analysis, resulting in a smaller number of charities in our analysis. A portion of those charities may not have submitted their data because they have ceased to operate. There can be long delays between charities shutting down and them appearing in ACNC revocation data.3
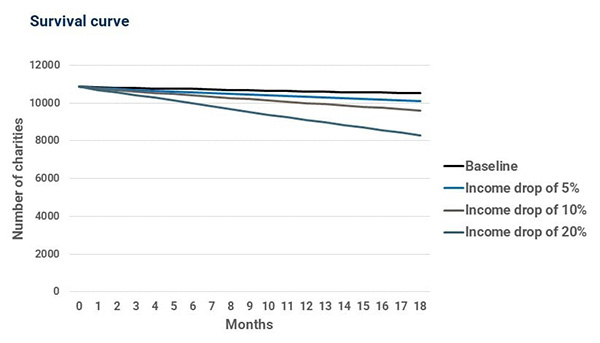
The continued vulnerability of a portion of the sector is highlighted further through our sensitivity analysis on 2021 charity viability (see Figure 5). A drop in income of all sources of 5%, 10% and 20% has been modelled and a survival curve developed showing the number of organisations that still have a financial buffer over time. With an income drop of 20%, after six months over 870 charities would have run out of net current assets to cover their ongoing deficits. After twelve months, over 1,700 charities (approximately 16%) would have no net current assets left.
Massive drop in volunteering
Another factor which may contribute to financial viability and certainly to charity health is the state of volunteering. Charities have experienced a dramatic reduction in the volunteer workforce. In 2021, there were 2.3 million fewer Australians volunteering than in 2019, representing a loss of 293 million hours in economic output from volunteers in a 12-month period.4 Volunteers are not only an incredibly important resource, but volunteering as an activity is one that builds social capital within the community.
At the report launch, The Hon Dr Andrew Leigh, MP, Assistant Minister for Competition, Charities and Treasury, said that having met charities around the country, he understands that there’s a huge challenge in getting volunteers.
The Hon Dr Andrew Leigh, MP, said, “One of the striking things is that the organisations that the report identified as the most financially fragile are also some of the organisations that speak to me about having the most difficulty getting volunteers. So in that sense, they’re being hit with the double whammy of having fewer people working with them, and fewer dollars in the bank.
“There is the sense that it’s harder to get volunteers. It’s great we’ve got the unemployment rate with the 3 in front of it, but it does mean that there’s fewer people available to volunteer. I think there’s still a lot of fear of Covid around the older volunteers.
There remains significant uncertainty about the effects of the pandemic on the number of operating charities, particularly those relying exclusively on a volunteer workforce. At the time of data collection, it was not possible to identify which charities may have ceased operating in 2021 as opposed to simply being late in their ACNC reporting. The analysis in this paper only captures those charities with a minimum 0.8 FTE.
Different experience for different parts of the sector
Examining the financial position of charities according to their main activity provides a more nuanced view of the different situations in different parts of the sector.
In 2021, the group of charities most likely to be making a loss were those whose main activities were categorised as ‘other philanthropic intermediaries and voluntarism promotion’ (32.2% made a loss), followed by income support charities (32.0% made a loss) (see Figure 6). Charities focused on international activities, research and aged care also had a relatively high proportion that were loss-making. Sporting charities were those most likely to run a surplus (84.8% of these charities made some surplus).
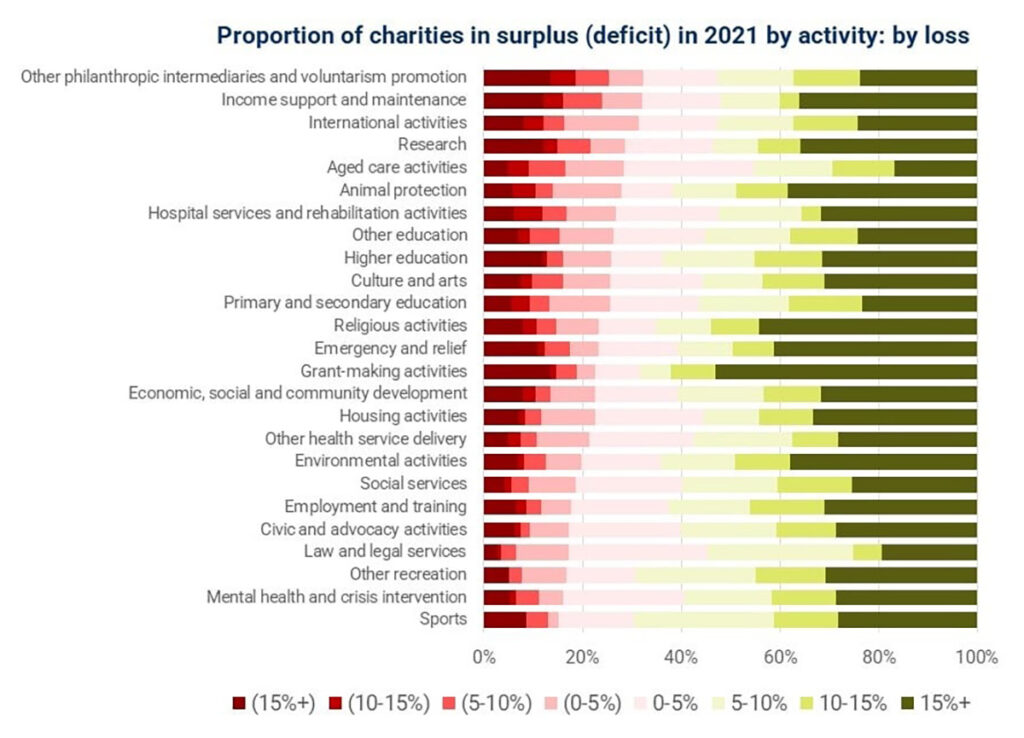
Considering the relative financial exposure of different parts of the sector, we identified that charities focused on grant-making, religious activities and emergency relief were most likely to run a large surplus (see Figure 7). 44.2% of charities that focused on religious activities and 41.2% of charities that focused on emergency relief showed a surplus of more than 15%. By comparison only 16.7% of aged care charities had a surplus greater than 15%, and 54.9% of these charities made a loss or small surplus (of less than 5%).

It should be noted that the data does not distinguish between service delivery organisations and philanthropic organisations, who have had very different pressures and spending patterns throughout the pandemic. The proportions of different kinds of organisations can be difficult to know for certain but there are 7,000 philanthropic funds, trusts and organisations in Australia, many of which are registered with the ACNC.5
Nonetheless, when combined with other sources, these data help to highlight the differential impacts on the sector due to the distinct circumstances for different groups of charities. For example:
- The need to protect a vulnerable client group meant the aged care sector was particularly impacted by Covid-19. Higher expenditure due to provision of personal protective equipment and stringent requirements for isolation of workers who were ill or exposed to Covid-19 likely contributed to financial precarity.
- Emergency and relief charities received significant injections of funds (for example a $200 million Government funding boost for emergency and food relief6). The strong surpluses in this sector may reflect the need for expenditure on recovery to commence after the initial crisis has passed and continue over a longer period.
- In states that experienced extended lockdowns, many sporting activities were put on hold – this may have constrained expenditure for sporting organisations, while sufficient income was retained (e.g. through JobKeeper) for financial sustainability.
- Other research undertaken by SVA has found that intermediary organisations can struggle to obtain appropriate funding to sustain their work and impact. See the report: [Insights on field building intermediaries].
- There is a risk with the rolling crises of natural disasters and the pandemic that weight of funding shifts towards crisis services – away from early intervention and prevention measures, which are ultimately more cost effective over time but take longer to see results.
Charities face future financial pressures
Charities continue to face a confluence of financial challenges in the current operating context.
The cost to deliver services is increasing. The sector is now faced with rising service delivery costs, primarily driven by the rapidly escalating cost of food and fuel. Inflation rose to 6.1% in the June quarter (2022) – the fastest annual increase in 21 years.7 Alarmingly, inflation is expected to continue to rise, reaching 7.75% by year end.8
- Charities are facing wage cost pressures. In June 2022, the Fair Work Commission announced a 5.2% increase to the national minimum wage and 4.6% increase to modern award minimum wage.9 The superannuation guarantee also increased by 0.5% as of 1 July 2022. As a result, the charitable sector is likely to face wage cost pressures.10
- Workforce shortages are a growing challenge, particularly for charities within the care economy. The most in-demand jobs in Australia currently include early childhood teachers and workers, registered nurses, child carers, and aged and disabled carers.11 If inflation outpaces wage rises, salaries for charity workers will start reducing in real terms. The sector already has issues with low pay and there is a risk of significant staff churn in the sector.
- Tightening household budgets are anticipated to impact donation levels. With rising inflation and cost of living pressures, there is a risk that donation levels will decline as households tighten their budgets.12 At the same time, the value of existing donations will reduce in real terms should inflation remain at its current level.13
- Structured giving has failed to keep pace with the accumulation of wealth. The Centre for Social Impact’s recent report High Net Wealth Giving: A Review of the Evidence showed giving by those in the Financial Review Philanthropy 50 List for 2022 had decreased 2.3% on the previous year, while the wealth held by the Top 200 Australian Financial Review (AFR) Rich List for 2022 grew by 15.7% on the previous year. Donations from wealthier individuals through Private Ancillary Funds (PAFs) could also be at risk if Australia experiences a significant economic downturn.14
These emerging pressures present significant risk to charities due to long-standing structural issues with funding and support. As previous Partners in Recovery reports have demonstrated, charities face different financial, legal and operational constraints to commercial businesses, which will make it harder for them to rebound from the pressures of the pandemic.15 Charity revenues don’t recover from downturns the same way that business revenues do. And they can’t easily access the resources they need to rebuild after crises.16
These constraints present genuine market failures that have been exacerbated by Covid, including:
- a lack of access to capital and flexible funding
- constraints on innovation and productivity. The Productivity Commission recognised these constraints in their landmark report on the non-profit sector more than 10 years ago, which informed their recommendation to extend some industry supports to the charity sector
- being in the business of public benefit. Charities operate not to respond to the demand of paying customers, but to public need – and funding does not always follow that need.
As Arminé Nalbandian, CEO of CSI, said at the launch: “Charities are not restricted by the bottom line incentives inherent to the private sector, because they’re in the business of public benefit. But the flip side is when demand increases or need increases, they’re doing more with less. So I think we need to be looking at the system holistically.
These constraints have profoundly shaped the way the sector operates. Widespread financial vulnerability has been further shaped by current funding arrangements – including short-term contracts; restrictions on how funding is used and counterproductive financial norms – such as ‘minimise overhead’ and ‘diversify revenue’ which can impede charities’ ability to achieve good outcomes.
SVA’s recent [Paying what it takes report] has found that not-for-profit organisations across Australia are, in general, not funded for the actual cost of what they do.17 Many charities find themselves with limited funds to invest in core capabilities, such as measurement and evaluation, training, IT and human resources. Despite research showing that not-for-profits that invest more in their indirect costs can be more effective than those that do not, true indirect costs are often under reported due to persistent beliefs about what funders are ‘willing’ to pay.18 This has led to chronic under investment in essential infrastructure as standard practice, and in turn to less effective operations and reduced impact.
Suzie Riddell: “What worries me most, and I hear this from the dozens of charity leaders that I interact with in my role, is when the attitude is we should just lean in and do more with less as though that’s a sustainable solution.”
Findings emphasise the importance of ‘paying what it takes’
The analysis highlights that financial support from government and philanthropists in response to sector advocacy was critical for the continued viability of the charity sector over the last two and half years. Yet the fundamental structural settings that contribute to the financial vulnerability of charities remain unchanged. With temporary funding ending in 2021, demand for services remaining high and emerging economic headwinds, many charities risk returning to the vulnerable position they were in prior to the pandemic.
To move beyond crisis and achieve the national benefits of a thriving charities sector, funding and policies are needed that provide tailored support for charities. Central to this is governments providing full funding for contracted services delivered by charities to meet service demand and cover the true costs of delivery. Funding should account for changes to charity cost structures, including compliance and regulation, and the ability to pay a market wage. In providing full funding, governments need to:
- Adequately cover indirect costs of service delivery to allow charities to invest in critical capability such as IT and digital capability, service quality and professional development.
- Improve stability of funding through adequate indexation and longer contracts.
- Design funding to achieve outcomes and retain the contract flexibility introduced during the pandemic.
- Shift funding from crisis services to prevention and early intervention.
- Examine the impact of one-off funds to support charity sector capability as a precursor to future targeted investment, noting full funding will take time to achieve and implement.
- Support alternative financing models, such as impact investing, to attract private capital to support charities and amplify their impact.
The October 2022 Commonwealth Budget provides partial indexation of funding for community organisations. It also highlights the wider economic pressures (rising inflation, rising cost of living, slowdown in economic growth) that continue to present a significant risk to charities. The sector will remain vulnerable while governments and philanthropists do not fund them for the full costs of what it takes to deliver services. Adequate funding to invest in core capabilities is crucial for thriving charities.
In terms of analysis, what next?
The report highlights some issues with the existing data on the financial viability of charities and potential areas for further investigation. For example, this could include examining the viability of different parts of the charity sector with longitudinal analysis to explore trends within subsectors.
What would be useful to you? We’d love to know what you would like us to explore further in our next Partners in Recovery report.
Notes
- Charities surviving from 2018 to 2021 were linked via ABN to perform a longitudinal analysis on all four years of available data. From the n=16,021 charities that were used in the initial analysis, n=10,186 charities survived across the four years to still be operating in 2021. Of these, 9,482 were involved in the longitudinal analyses.
- Australian Taxation Office (ATO), Taxation statistics 2019–20: JobKeeper, ATO website, n.d., accessed 31 August 2022.
- Australian Charities and Not-for-profits Commission (ACNC), Are there too many charities in Australia?, ACNC website, n.d., accessed 15 September 2022.
- Biddle and Gray, Volunteering during the first year of the Covid-19 pandemic.
- Philanthropy Australia, A blueprint to grow structured giving: how Australia can double structured giving by 2030, Philanthropy Australia, April 2021, accessed 15 September 2022.
- h S Convery and L Henriques-Gomes, ‘“We need to be alarmed”: food banks in overdrive as politicians allow Australians to go hungry’, The Guardian, 21 November 2021, accessed 13 September 2022.
- Australian Bureau of Statistics (ABS), Consumer Price Index, Australia, ABS website, June 2022, accessed 15 September 2022.
- ABS, Consumer Price Index, Australia.
- Fair Work Ombudsman, Minimum wages increase from 1 July 2022, Fair Work Ombudsman, Australian Government, 15 June 2022, accessed 15 September 2022.
- Australian Council of Social Service (ACOSS), Increase to minimum wage welcome recognition of those who have carried us through our toughest times [media release], ACOSS website, 5 June 2022, 15 September 2022.
- S Maiden, ‘The ten most in-demand professions in Australia’, news.com.au, 22 August 2022, accessed 15 September 2022.
- J O’Halloran, Rising inflation: what do charities need to know? Pro Bono Economics website, 19 January 2022, accessed 15 September 2022.
- O’Halloran, Rising inflation: what do charities need to know?
- P Flatau, L Lester, JT Brown, M Kyron, Z Callis and K Muir, High net wealth giving in Australia: a review of the evidence [PDF], Centre for Social Impact: UNSW and UWA, August 2022, accessed 14 September 2022.
- Social Ventures Australia (SVA) and Centre for Social Impact (CSI) Partners in recovery: why charities need tailored support, SVA and CSI, July 2020, accessed 15 September 2022.
- SVA and CSI, Partners in recovery: why charities need tailored support.
- Social Ventures Australia (SVA) and Centre for Social Impact (CSI), Paying what it takes: funding indirect costs to create long-term impact, SVA and CSI, March 2022, accessed 15 September 2022.
- SVA and CSI, Paying what it takes: funding indirect costs to create long-term impact.
Written by

Never miss an update
Subscribe to receive our Quarterly articles, news updates, and invitations.
Share this article


Copied to clipboard
Related information


First Nations peoples should be aware that this website may contain the images, voices or names of people who have passed away.