
Mapping child and family hardship across Australia
Around 107,000 Australian children from 0-6 years are experiencing significant socioeconomic disadvantage. Understanding where these children are helps us better advocate for the services they need.
- Early Years
 11 min read
Summary
- One hundred and seven thousand children aged birth to six-years-old are experiencing significant hardship and living in communities with high levels of disadvantage. These children are the ones most likely to benefit from the services of an early childhood hub.
- Geographic modelling identified the 706 communities across Australia with the highest levels of socioeconomic disadvantage and early childhood vulnerability; population modelling estimated the numbers of children from birth to six-years-old experiencing significant hardship within those communities.
- The need ranking results show that the eastern states make up the greatest proportion of the 706 communities, largely due to the high concentration of the Australian population in metropolitan areas in eastern states. Regional and rural areas also rank highly in terms of relative levels of need. So too do the growth corridors in the cities that have experienced significantly high population growth.
- Communities ranked as having the highest levels of community need have a higher number of Aboriginal and Torres Strait Islander children relative to the national average.
- Communities in major cities tend to have larger actual populations of children experiencing significant hardship.
- An interactive map showcases this need data. The map spotlights the 706 communities ranked according to the extent of socioeconomic disadvantage and childhood vulnerability in those areas and provides key statistics for each area including the number of children and the location of existing hubs.
This article looks at the geographic spread of significant early childhood disadvantage in Australia and identifies locations with the highest levels of disadvantage. It also quantifies the level of need in each location to target and advocate for early childhood hubs.
It also provides data which will help identify areas of need for service providers and funders working in child and family related fields.
Why identify the location of children needing support?
The majority of children in Australia are doing well, however significant inequalities in developmental and educational outcomes exist between children experiencing socio-economic vulnerability and their peers.
Nearly 20% of children are experiencing poverty in Australia. Children living in the most socio-economically disadvantaged areas are more than twice as likely to be developmentally vulnerable on one or more AEDC (Australian Early Development Census) domains (33.2% and 14.9% respectively). And they are more than three times more likely to be vulnerable on two or more domains compared to children in the least disadvantaged locations (19.1% and 6.7% respectively).
Aboriginal and Torres Strait Islander children are more than twice as likely as other children to be developmentally vulnerable. And research shows that children who are developmentally vulnerable on school entry are less likely to do well at school, are more likely to leave school early and have poorer life outcomes.
… close to 107,000 children aged birth to six-years-old across Australia are experiencing significant hardship and living in communities with high levels of disadvantage.
SVA has a goal for a national, early childhood development policy framework and service system that provides high-quality integrated supports to children experiencing socio-economic vulnerability from birth to six-years-old.
Working in partnership with the Centre for Community Child Health (CCCH) at the Murdoch Children’s Research Institute, SVA commissioned Deloitte Access Economics to identify how many children across Australia are experiencing high levels of socioeconomic disadvantage and developmental vulnerability.
The report identified the most high-need communities based on measures of both socio-economic early childhood disadvantage and early childhood vulnerability. It also quantified the number and concentration of children experiencing the most significant disadvantage within these communities.
The research identified close to 107,000 children aged birth to six-years-old across Australia are experiencing significant hardship and living in communities with high levels of disadvantage. For the purposes of the report, this is used as an indicative measure of those who would most benefit from an early childhood hub. We previously referred to these as integrated children and family centres (ICFCs), see Integrated child and family centres overcome fragmented delivery.
An early childhood hub is a centre where children and their families can go to access key services and connect with other families. Early childhood hubs provide a range of child and family services including early learning programs, maternal and child health and family support programs, as well as tiered services for families who need them.
This article draws on the data provided in the report, Exploring need and funding models for a national approach to integrated child and family centres.
Methodology for modelling priority need
The methodology firstly identified the areas of highest community need, via geographic modelling.
The modelling used ‘communities’ as defined by the Australian Bureau of Statistics (ABS) as Statistical Area Level 2s (SA2s)1. These are intended to represent a community that interacts together socially and economically. Population sizes range from 3,000 to 25,000 and geographical areas vary greatly too.
So for example, Halls Creek in WA has a population of 4,140 across an area of over 135,000km2; Wacol in Ipswich, Queensland is a community of 6,440 across 19km2; and Liverpool East in Western Sydney has a population of 18,597 across 2km2.2
Communities were added to a shortlist if they were classified by the ABS as being in the lowest 40% of Socio-Economic Index for Areas (SEIFA)3 and had over 10% of children developmentally vulnerable on two or more domains on the Australian Early Development Census (AEDC)4. The modelling identified a shortlist of 706 communities as areas of need (see below).
The shortlisted communities were then ranked by need using equal weighting according to the extent of socio-economic disadvantage and childhood developmental vulnerability in those areas. The highest ranked communities are those that have both the highest levels of disadvantage in terms of both socio-economic disadvantage overall and the portion of children who are highly disadvantaged within the community.
This identified the number and proportion of children in each of the shortlisted communities who are experiencing significant hardship…
The second stage, the population modelling, quantified the level of need for early childhood hubs. That is the number of children from birth to six-years-old in the shortlisted communities (SA2s) living in families that meet certain criteria: income below the poverty line, unemployed, and/or living in social housing (based on ABS Census data). At a population level, nationally, these were seen as the best predictive indicators of the likelihood of experiencing significant socio-economic disadvantage.
This identified the number and proportion of children in each of the shortlisted communities who are experiencing significant hardship and likely to benefit most from the services of an early childhood hub.
It’s important to note that the modelling required defining specific quantitative thresholds of need to generate results. However, it is recognised that need for early childhood hubs – which is captured here through measures of socio-economic disadvantage and developmental vulnerability – sits along a spectrum. As such, the modelling does not imply that specifically (and only) the 107,000 children identified would benefit from early childhood hubs. Rather, this provides an indication of the level of priority need.
Geographic modelling: prioritising areas of need
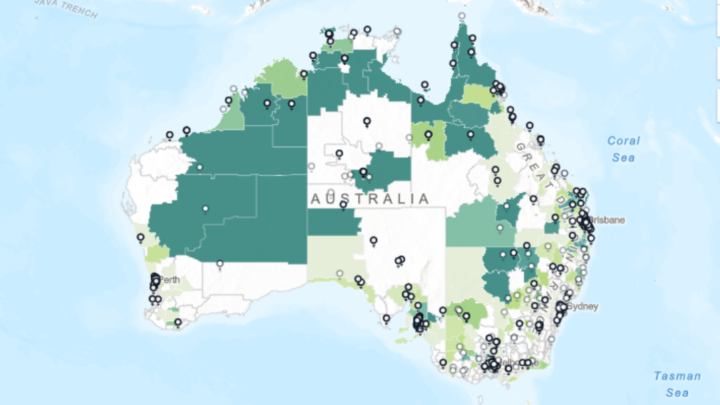
The report identified 706 communities with the highest level of community need due to the extent of socio-economic disadvantage and developmental vulnerability of children and families in those regions. This represents nearly 30% of all communities in Australia.
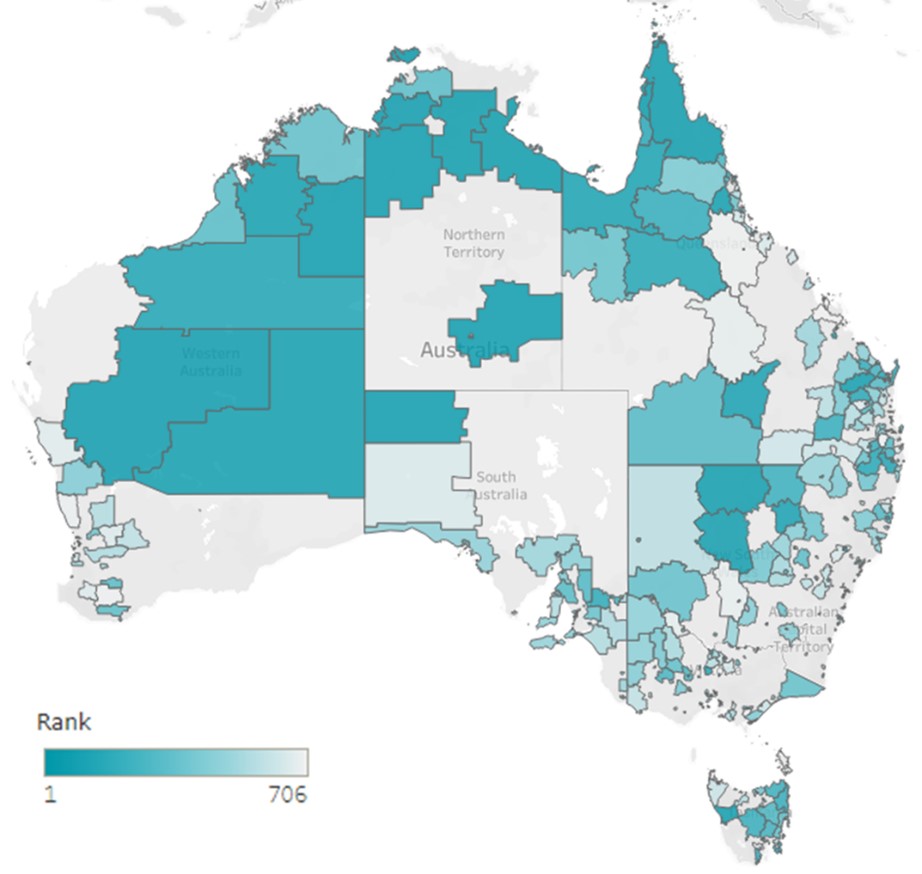
Figure 1 displays the ranking of all the shortlisted 706 communities. When interpreting the results, it should be understood that rural and regional SA2s tend to be geographically larger than metropolitan areas due to lower population density. As a result, WA appears overrepresented in Figure 1. However, only 9% of all shortlisted communities are in WA.
Interactive map on needs data
The data is also available in an interactive map. This map shows the locations of the 706 communities with the highest level of need due to the extent of socio-economic disadvantage and vulnerability of children and families. It also provides the national and state ranking and other key statistics for each area, including the location of early childhood hubs.
Queensland and NSW together… comprise 54% of the shortlist with almost 200 shortlisted communities each.
Communities of most need
The need ranking results show that the eastern states make up the greatest proportion of the 706 shortlisted communities, largely due to the high concentration of the Australian population in metropolitan areas in eastern states. For example, Queensland and NSW together represent 48% of total communities and comprise 54% of the shortlist with almost 200 shortlisted communities each.
Regional and rural areas also rank highly in terms of relative levels of need. Over two thirds of the 706 shortlisted communities are classified as remote or regional.5
[The NT] has six of the 10 communities in Australia ranked as having the highest levels of disadvantage.
Nine of the 10 highest ranked communities are located in remote or regional areas. Of the 50 highest ranked communities, 35 are remote or regional, with 22 classified as remote and 13 regional.
The model demonstrates a significant level of disadvantage in the Northern Territory. Although SA2s in the NT only account for 2% of the entire shortlist of 706 communities, it has six of the 10 communities in Australia ranked as having the highest levels of disadvantage.
The 10 communities with the highest level of need nationally are shown in Table 1 below. The SA4 describes the larger area that each SA2 is within. This gives an indicator of whether the SA2 is rural, regional, or in a metropolitan area.
| National Rank | SA2 Name | State | Area (SA4) | Remoteness Classification |
|---|---|---|---|---|
| 1 | Tiwi Islands | Northern Territory | Northern Territory – Outback | Remote |
| 2 | APY Lands | South Australia | South Australia – Outback | Remote |
| 3 | Victoria River | Northern Territory | Northern Territory – Outback | Remote |
| 4 | Sandover – Plenty | Northern Territory | Northern Territory – Outback | Remote |
| 5 | Halls Creek | Western Australia | Western Australia – Outback (North) | Remote |
| 6 | Thamarrurr | Northern Territory | Northern Territory – Outback | Remote |
| 7 | Moulden | Northern Territory | Darwin | Regional |
| 8 | Meekatharra | Western Australia | Western Australia – Outback (South) | Remote |
| 9 | Daly | Northern Territory | Northern Territory – Outback | Remote |
| 10 | Wacol | Queensland | Ipswich | Major City |
Population modelling: quantifying the level of need
Population modelling complemented the geographic needs analysis estimating the number and proportion of children from birth to six-years-old experiencing significant hardship in each of the shortlisted 706 SA2s. This was identified using parent and family characteristics of need described above – children with parents who are unemployed, have low income, or live in social housing.
The modelling estimated there are 107,000 children from birth to six-years-old across the 706 communities experiencing the most significant disadvantage. This represents 5% of the total children (birth to six-years-old) in Australia, and around 17% across the 706 communities.
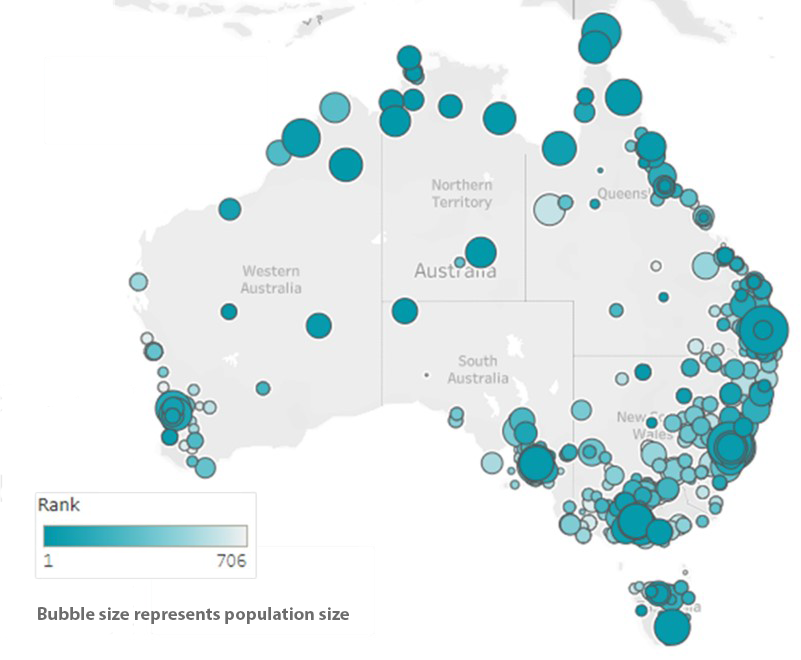
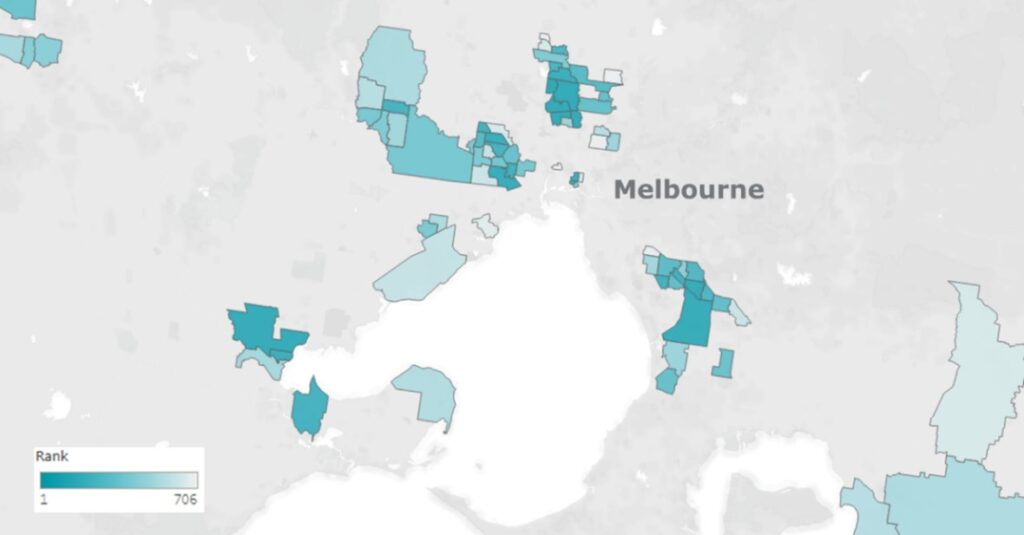
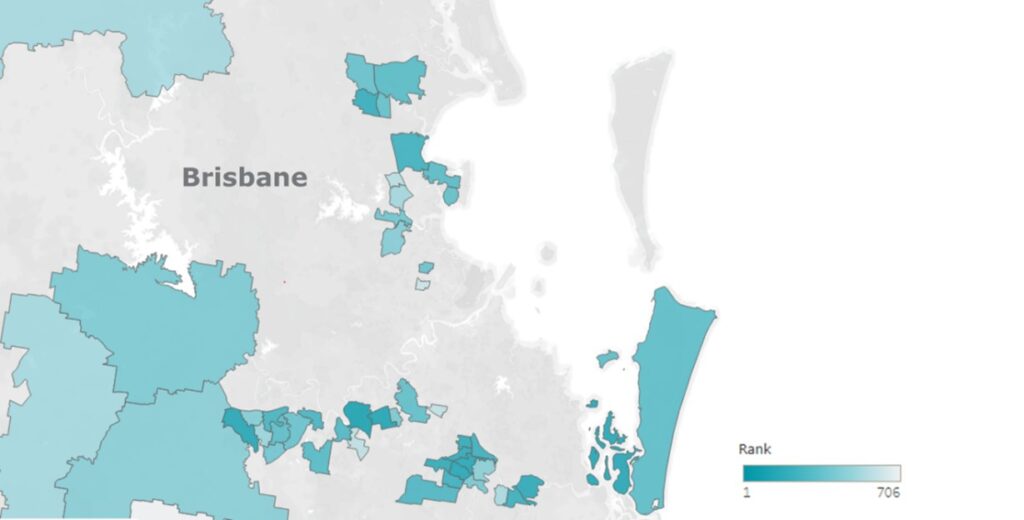
Figure 2 shows the relative size of the population of birth to six-year-old children experiencing significant hardship in each of the shortlisted communities. This map demonstrates the correlation between the geographic and population modelling, with larger, darker bubbles showing the SA2s with higher levels of community-level disadvantage as well as larger populations of children experiencing significant hardship.
So for example, Halls Creek in WA ranked 5th nationally. It has 435 children from birth to six-years-old and all of these children are estimated to be experiencing significant hardship. Moulden, a suburb of Darwin, ranked 7th nationally. It has 343 children, of which 120 children or 35% are estimated to be experiencing significant hardship. And Liverpool East in Sydney ranked 68th nationally, has 1899 children, of which 22% or 420 are facing significant hardship.
Aboriginal and Torres Strait Islander children
The research highlights some specific insights about Aboriginal and Torres Strait Islander children. The communities ranked as having the highest levels of community need have a higher number of Aboriginal and Torres Strait Islander children relative to the national average.
In the 2021 Census, 3.2% of the total Australian population identified as Aboriginal and/or Torres Strait Islander.
However, in the 10 communities ranked as having the highest levels of community need, the average portion of the population that are Aboriginal and Torres Strait Islander is 63%. In four of the highest ranked communities, Tiwi Islands, APY Lands, Sandover – Plenty and Thamarrurr, Aboriginal and Torres Strait Islander people represent over 85% of the whole population.
This indicates that Aboriginal and Torres Strait Islander children are overrepresented in SA2s with the highest levels of community disadvantage.
Aboriginal and Torres Strait Islander community-controlled early learning services have huge potential to improve the outcomes for First Nations children and families.
Currently in Australia, Aboriginal and Torres Strait Islander children are more than twice as likely as all other children to be developmentally vulnerable when they start school. High-quality early childhood education and integrated, family-focussed early childhood programs can improve outcomes for children, particularly when implemented with a focus on essential principles such as Aboriginal and Torres Strait Islander community ownership and leadership; embedding culture; sustainability; and a holistic approach that is responsive to need.6
Aboriginal and Torres Strait Islander community-controlled early learning services have huge potential to improve the outcomes for First Nations children and families. However, these organisations face many challenges that inhibit their success.
SVA is supporting SNAICC – National Voice for Our Children, to grow a strong network of culturally safe and accessible early years integrated services for Aboriginal and Torres Strait Islander children. SNAICC has been working persistently for over 40 years to bring social justice and policy reform to support the Aboriginal and Torres Strait Islander community-controlled sector, including through advocating for a unique funding model that is more responsive to community need.
High need exists in growth corridors in metropolitan communities
The need ranking results show that within large cities and towns, a concentration of high need communities are found in areas that have recently experienced significant population growth. For example, Liverpool East is the 10th highest need community in NSW and has seen 40% population growth from 2011 to 2021.
Dandenong South in Melbourne, and Wacol and Inala Richlands in Ipswich, have seen 31%, 24%, and 27% population growth respectively from 2011 to 2021. Recent growth in these outer city areas has led to fast population growth of lower income families, which has led to a higher concentration of disadvantage in these areas.
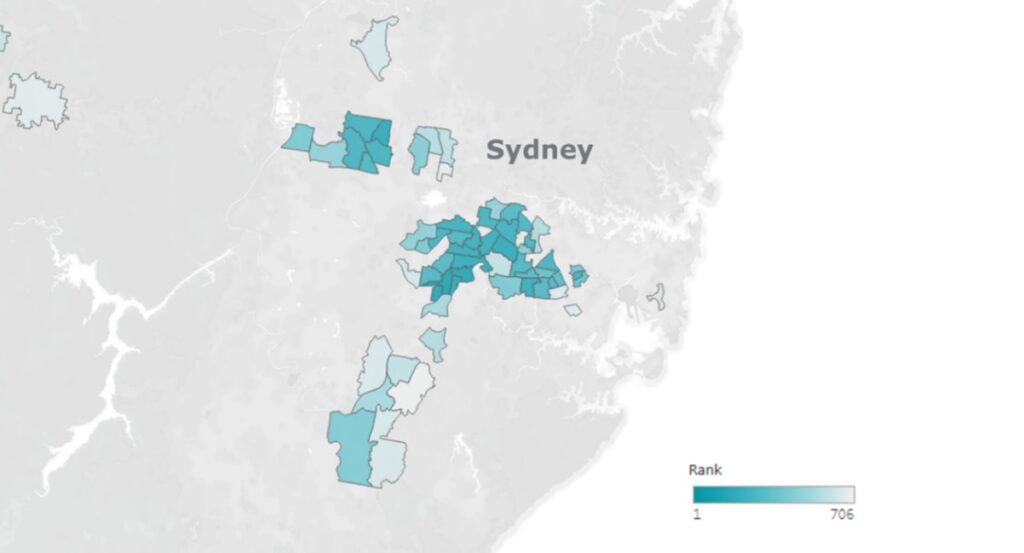
Communities in major cities also tend to have larger populations of children experiencing significant hardship. Of the 50 communities with the largest population of children experiencing significant hardship, 41 are in capital cities. Over half of these communities are in Greater Sydney and seven are in Greater Melbourne.
Figure 3, Figure 4, and Figure 5 show the results in detail within select metropolitan areas in Sydney, Melbourne, and Brisbane respectively. SA2s shaded darker indicates a higher level of need.
High ranking remote and regional communities
Among remote and regional communities there is significant variability in the size of the overall population of children. Many communities have relatively small populations such as Western in SA (8 children), Croydon – Etheridge in Queensland (94 children) and Forestier – Tasman in Tasmania (103 children).
This is in contrast to other regional and rural communities such as Caboolture – South and Mt Isa in Queensland and Nowra in NSW which all have more than 2000 children. The proportion of children experiencing the most significant disadvantage is also broad ranging, with several remote communities estimated to have 100% of children and others with as low as 2% (Rockhampton surrounds, Queensland).
These population variances need to be considered in the context of the geographical size of these communities too. With, for example, Croydon – Etheridge mentioned above having an area of close to 70,000 km2 and only 94 children while Nowra is 102km2 with over 2,000 children.
Over a hundred thousand children living with significant hardship
The most important finding from the research is that 107,000 children across Australia are experiencing significant hardship and living in families and communities with high levels of disadvantage. This is devastating.
We know the risks of lifelong impacts of early childhood disadvantage. But this is also a critical opportunity. We know that the earlier we can provide access to services and supports, the better the child’s lifelong education, health, employment and wellbeing outcomes will be.
Variability across communities
The data demonstrates significant variability across communities in terms of the overall population of children aged birth to six-years-old and the proportion of those children experiencing the most significant disadvantage. In addition, the density of the childhood population (the number of children per/km2) experiencing significant hardship varies enormously.
What the data shows is that there is no typical remote, regional or metropolitan community and the needs of each will be unique. While these communities share some common characteristics of socioeconomic disadvantage, they are very diverse in terms of geographical isolation and cultural attributes. This raises important questions for policy makers in terms of how to ensure the best outcomes for these children.
Implementation questions
SVA’s work on early childhood hubs is exploring what is needed to successfully scale hubs nationally. This data helps to better understand the profiles of different communities and raises important questions around implementation.
For example, what needs to be considered when planning an early childhood hub in a highly populated metropolitan community with a small proportion of children experiencing significant disadvantage, as opposed to a sparsely populated remote community where the majority of children are experiencing significant disadvantage?
This data is strengthening advocacy for a national approach to scaling early childhood hubs…
Another key implementation question coming out of the data is the tension between hubs incorporating prescribed services and supports and being responsive to the unique needs of each community. The diversity of communities described in the research suggests that a cookie cutter approach to designing an early childhood hub won’t be most impactful.
This is a challenge that faces many policy makers: how to ensure consistent, evidence-based practice whilst also recognising that any intervention will only succeed if it is relevant and appropriate to the community it serves.
Early childhood hubs critical
When communities are facing multiple levels of disadvantage and families have complex needs, an early childhood hub is critical. It provides a safe place for families to come together, to increase their social networks, be supported to identify and access the opportunities and services they may need. And to be able to do so from the one location without needing to retell their story multiple times.
This data is strengthening advocacy for a national approach to scaling early childhood hubs so that more children are able to benefit from a hub. This will require a joined-up approach from all levels of government and the sector, recognising that the breadth and depth of need described above is beyond the scope of any single tier of government.
We hope that this data will also enable other services to be more informed and targeted.
Notes
- There are 2,473 SA2s in Australia, as defined by the ABS. Selecting a small area level like SA2s was determined to appropriately capture the need, at a community level, for the purposes of contemplating early childhood hubprovision.
- ABS, Regional population 2021-22: population change, ABS website, 2022, accessed 20 May 2024
- This index includes variables for the portion of the population with a low income, jobless parents, no internet connection, no education beyond year 12, who are unemployed, pay low rent, have a disability, are separated or divorced, are employed in a low skilled job, do not have a car, live in an overcrowded dwelling, or do not speak English well.
- The AEDC tracks whether children are ‘on track’, ‘at risk’ or ‘vulnerable’ across five domains. The domains are physical health and wellbeing, social competence, emotional maturity, language and cognitive skills (school based), and communication skills and general knowledge.
- At the larger SA4 level which gives an indicator of whether the SA2 is rural, regional, or in a metropolitan area.
- E Sydenham, Ensuring equality for Aboriginal and Torres Strait Islander children in the early years [PDF] [discussion paper], Early Childhood Australia (ECA) and SNAICC – National Voice for our Children, 2019
Written by
Contributors
Never miss an update
Subscribe to receive our monthly newsletters that include thought leadership articles, reports, news and webinar invitations.
Share this article


Copied to clipboard
Other resources
Related information


First Nations peoples should be aware that this website may contain the images, voices or names of people who have passed away.